Microsoft Project: Formatting a Gantt Chart for Summary Task
Microsoft Project, Microsoft Project 2010
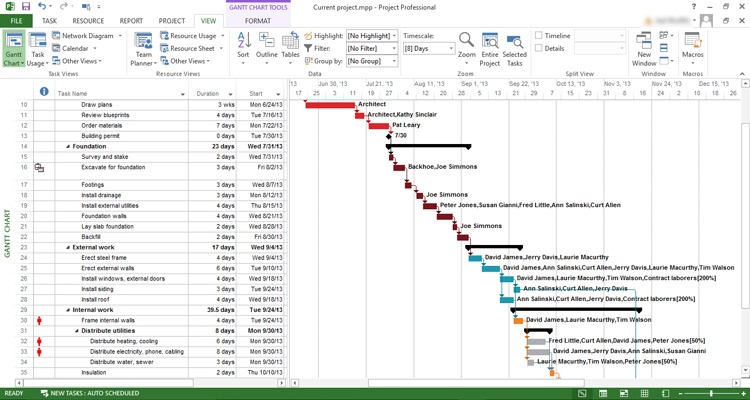
Recently a student posed a question during a Microsoft Project class. How does one format the bars of a Gantt chart to look the same for each unique summary task? Something that may look like this.
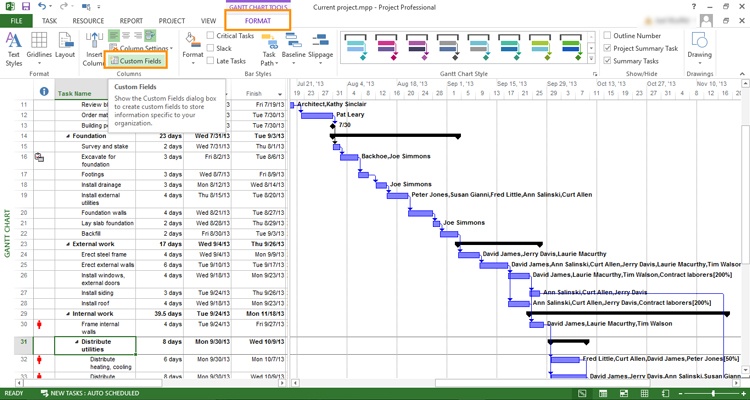
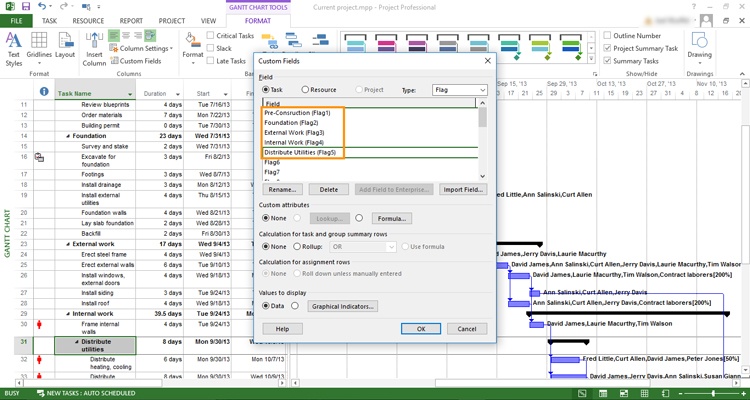
It begins with creating a custom flag field for each summary task. In Microsoft Project a flag field is a basic Boolean value. A simple yes/no field to identify further action. They are created using the Custom Fields button on the Format tab within the Gantt Chart Tools of the ribbon.
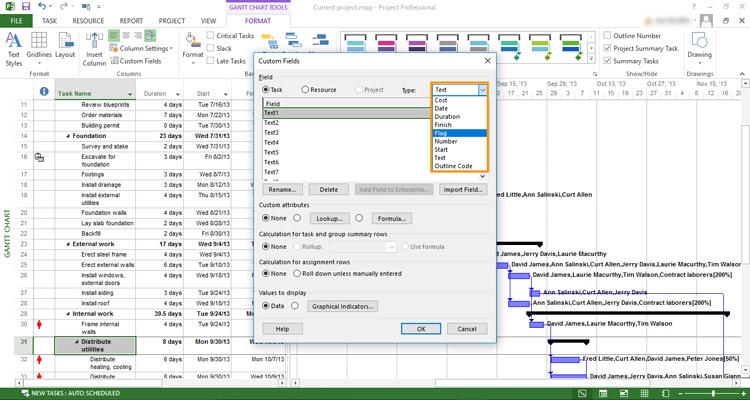
The Custom Fields button opens a separate dialog box with many options. Our first choice will be to select flag from the drop down list of data fields in the upper right-hand corner. We are presented with twenty (20) flag fields. Our example uses five (5) and each one needs a unique name.
That can be accomplished by selecting a flag, clicking rename, and supplying the new value.
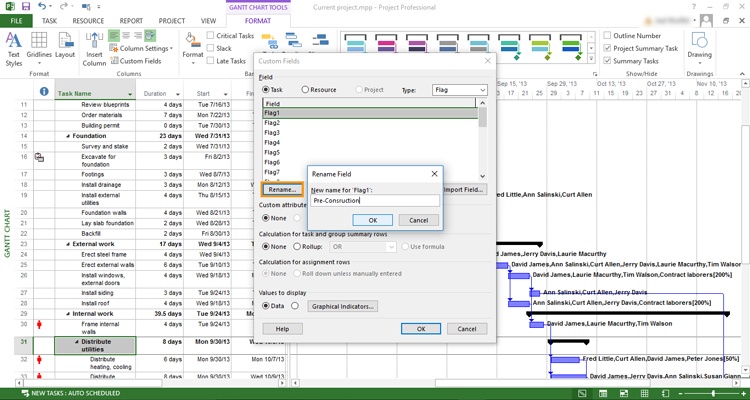
Once our five (5) flags have been named we can click OK to close the Custom Fields window.
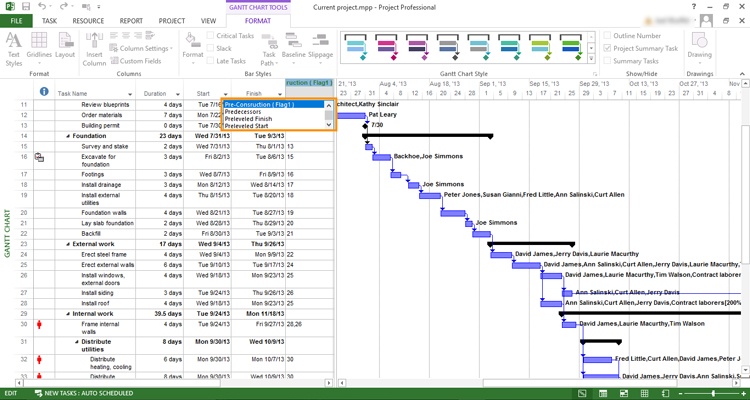
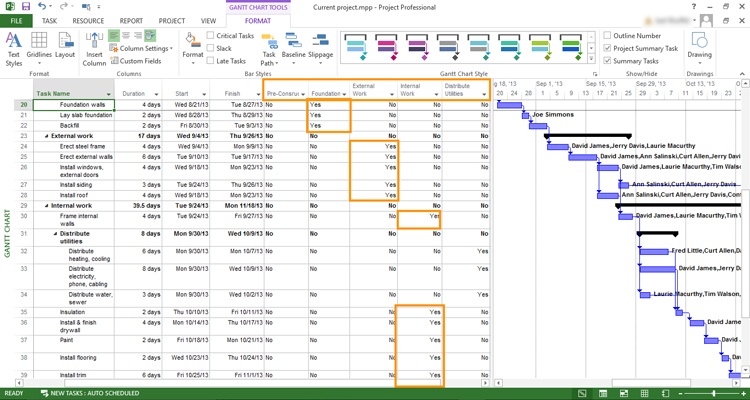
Next we need to mark our tasks as active (yes) or inactive (no) using the flags we just created. Insert a new column in the sheet view of the Gantt chart using one of our flag fields.
The entire column defaults to no but we will select the first task of our named summary and change its value to yes.
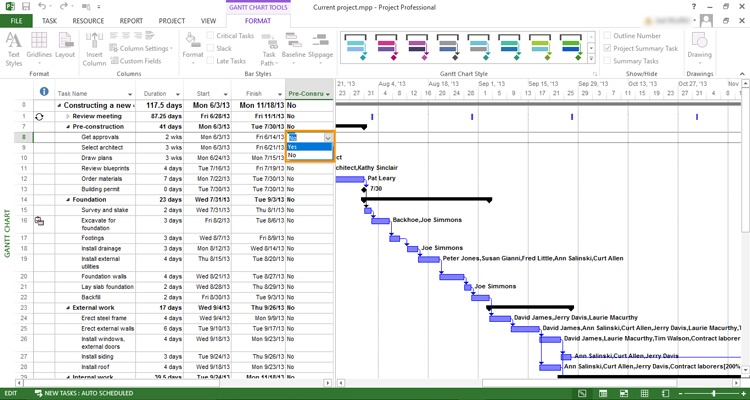
Once selected we can use the auto-fill handle (just like in Excel) to copy our yes across the remaining subtasks.
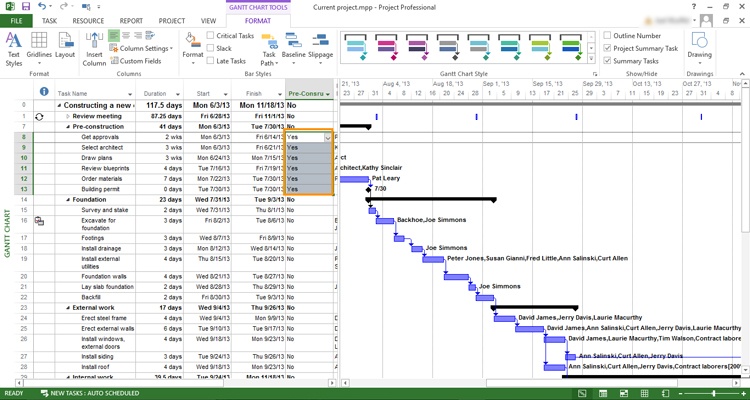
We will insert a column for each of our summary tasks and repeat the process described above.
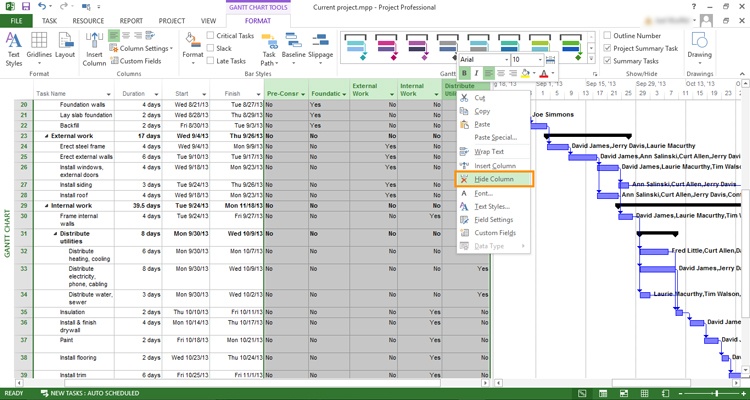
The great thing is, once the tasks have been flagged we can hide the additional columns we just inserted.
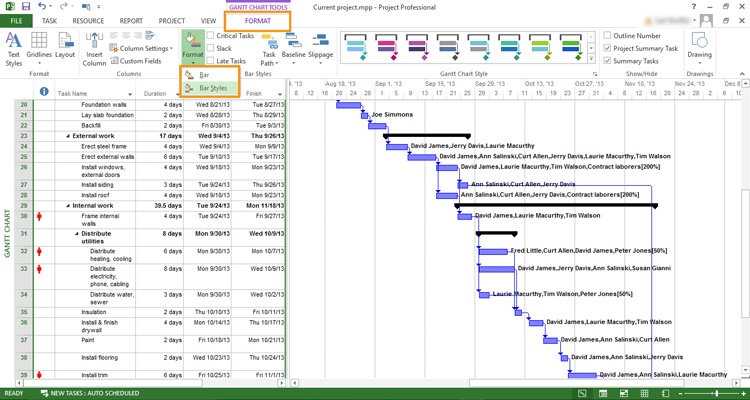
At this point we are in the home stretch. There is only one more step necessary to finish. We need some custom bar styles to match our flagged tasks and that is done by choosing the Format tab within the Gantt Chart Tools of the ribbon and selecting Bar Styles from the Format button in the Bar Styles group. You can also double-click a blank area within the chart side of the Gantt Chart View.
In the Bar Styles dialog box we will scroll to the bottom of the list and add a new entry for each of our summary tasks using the name we gave to each flag. Shape, pattern, and color can be applied to each group and of course the flag number will be selected in the Show For … Tasks column.
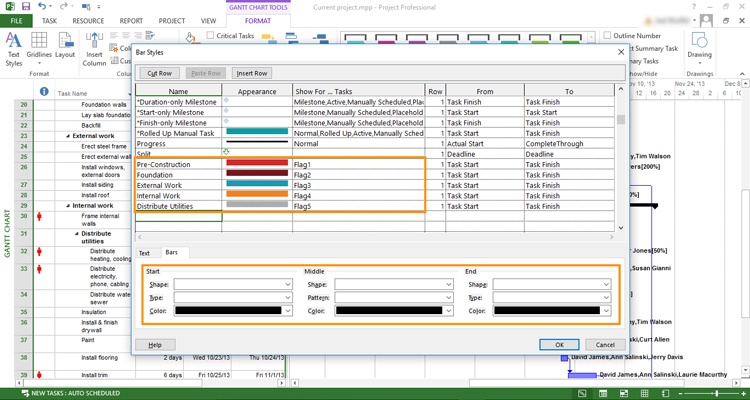
Once complete, clicking OK will supply our newly flagged and formatted Gantt bars with the shape, pattern, and color we just set up.