How to Format the Gantt Chart in Project
Microsoft Office, Microsoft Project
Recently, I had a question about formatting the Gantt chart from a student who mentioned the issue of color-blindness. Since various kinds of this problem exist, knowing how to get around it can be helpful, just in case. As critical tasks are highlighted in red, it could be an issue. The Gantt chart, after all, depends at least in part on color, or so we normally think. But there are ways around it.
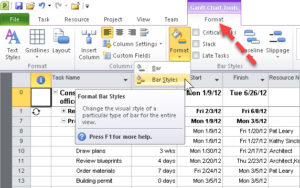
To start the process, we go to the Gantt Chart Tools Format tab, and click the Format button in the Bar Styles group. We then have to go to the drop-down, and click Bar Styles there.
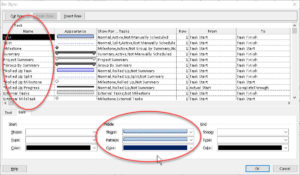
Then comes the big box. The key is understanding its layout. In the upper half, the names of the chart elements are listed on the left, and the appearance and other attributes go in each row.
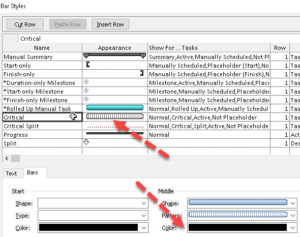
What one has to do is select an element name on the left, then look down at the lower half of the box, usually to the Bars tab (we’ll deal with Text in a sec). For the regular Gantt bars, the kind we usually concern ourselves with, the Middle section is the one we need to tweak. Shape and Pattern are important, but Color is the main thing. If we’re dealing with someone who has red-green color blindness, the ability to change color for critical tasks is certainly going to be a help. Better still, we can change the pattern—which lets us put color aside when we need to.
Once we make the changes, we’re good to go.
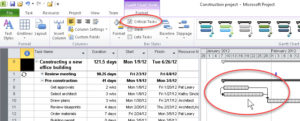
Downside is, the Critical Tasks checkmark needs to stay on when one formats the critical task bar appearance. Turn it off, even for a second, and it loses the formatting we apply to critical task bars. (If anyone finds or has a solution to this problem, I’d be glad to hear it. 🙂 )
Adding text to the bars happens in the Text tab downleft. This can be a help too, but one doesn’t want to overdo it. The left side of the Gantt chart has text aplenty.
For more on working with Microsoft Project, go for our Microsoft Project training.


