Microsoft Project – Display Estimated Durations with a Different Color in a Gantt Chart
Microsoft Office, Microsoft Project
When working with tasks in a project, it is common practice to display a duration as an estimate. Displaying an estimated duration prepares the viewer for possible changes in scheduling. An estimated duration takes the form of a question mark placed after the declared duration.

The issue is that some project viewers fail to notice the question mark; then when durations are updated, project viewers wonder why things have changed. One way to ensure that people’s attention is drawn to the estimated durations is to change the color of the Gantt bars to reflect an estimated status. There is no built-in state for displaying estimated durations in a separate color, but with a few short clicks this behavior can be achieved.
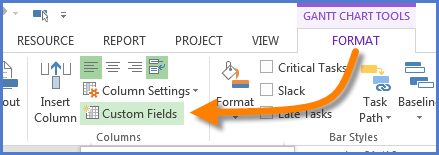
Select the Gantt Chart Tools – Format tab, then in the Columns group click Custom Fields
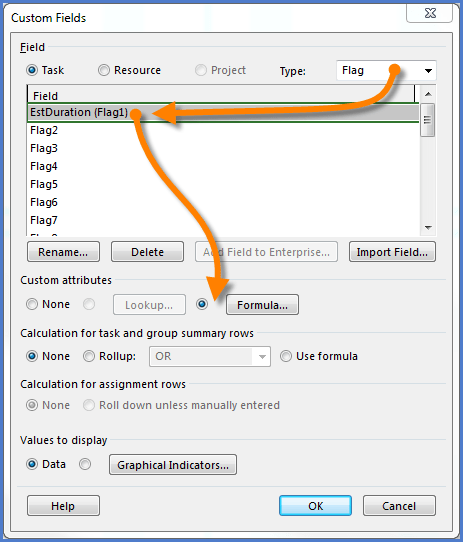
Change the Type category (upper right) to Flag.
Select a flag field (such as Flag1) and rename the field (ex: “EstDuration”)
In the Custom Attributes section, select the Formula radio button and click the Formula button
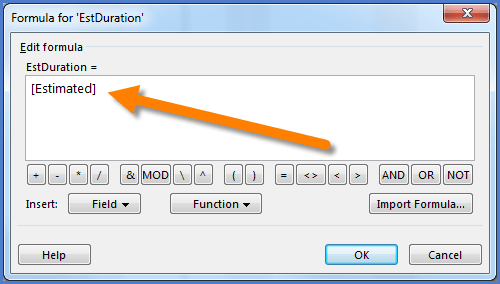
In the formula construction field, type [Estimated].
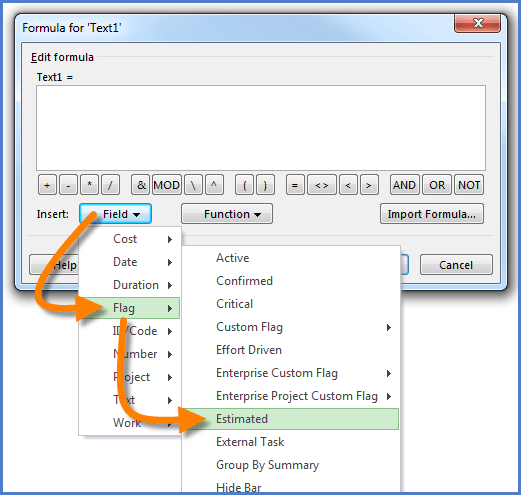
This can also be inserted via mouse click by clicking Insert – Field – Flag – Estimated.
Now that you have set up the underlying logic of detecting the estimated duration, you can now use it as a display trigger for bars in the Gantt Chart.
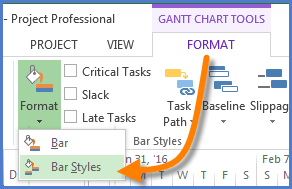
On the Gantt Chart Tools – Format tab, in the Bar Styles group, click Format – Bar Styles
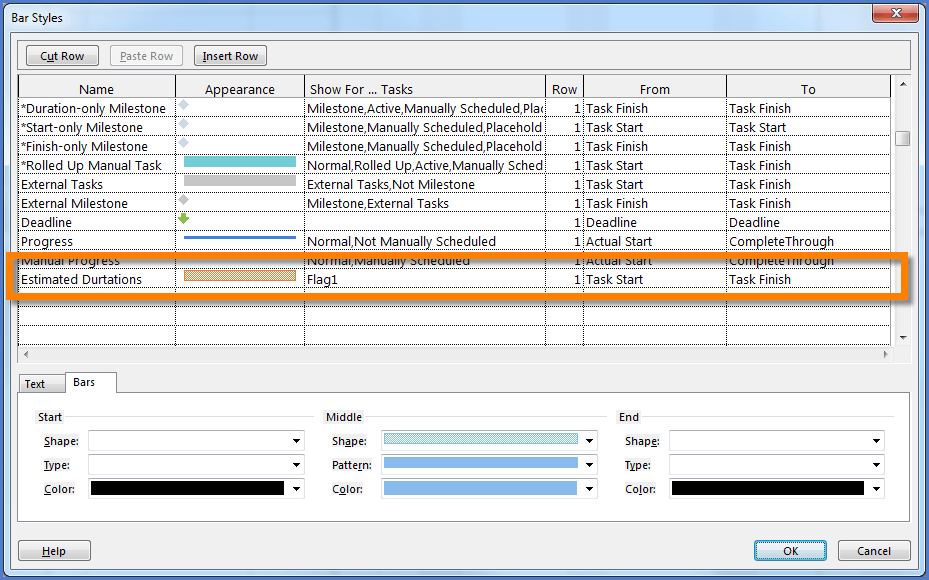
Scroll to the bottom of the list and pick the first available slot.
In the Name column, provide a name of your choosing (ex: “Estimated Durations”)
In the Appearance column, select a color and line style of your choosing. These controls are located at the bottom of the dialog box.
In the Show For … Tasks, select the Flag1 field from the provided list.
Leave all other column settings at their defaults.
Now bask in the glory of custom colored estimates.
