How to use the console to debug in JavaScript
JavaScript, Web Design
JavaScript is a great language. It allows you to add all kinds of interactivity into your webpages. However, sooner or later, we will make mistakes in our code. The good thing is Chrome and FireFox both have JavaScript debuggers built into them so finding the general area where the code has issues isn’t too hard. Let’s take this code for example:
var x = “Hi”;
alert(x);
This code works fine, it sets up a variable called x that has the string “Hi” as a value and then alerts it to the window as a pop-up window of sorts. However, if I were to accidentally misspell alert like this:
var x = “Hi”;
alrt(x);
The code wouldn’t work. My suggestion, whenever the code doesn’t work, is to head straight to the console by pressing F12 in either Chrome or FireFox. You can also right-click the page and choose “Inspect” in Chrome or “Inspect Element” in FireFox. After the developer window comes up, make sure to click on the “console” tab and you’ll see this is the error in Chrome:
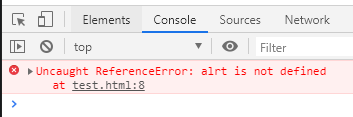
It tells me alrt is not defined at test.html:8. This means there’s an issue with alrt on the file test.html on line 8. So it’s very helpful in getting us close to the problem. The debuggers built into Chrome and FireFox are very powerful and will help you fix your code when mistakes are made. If you want to learn more be sure to check out our JavaScript training. Have an amazing day!