Qlikview Chart Styling Using Expression Attributes
Business Intelligence, QlikView
Qlikview makes it quick and easy to assemble your data into a professional BI application. But sometimes the information needs a little boost, that extra touch that makes the difference.
One way to accomplish this is using Expression Attributes. These attributes can be found on the Expression tab of your chart object.
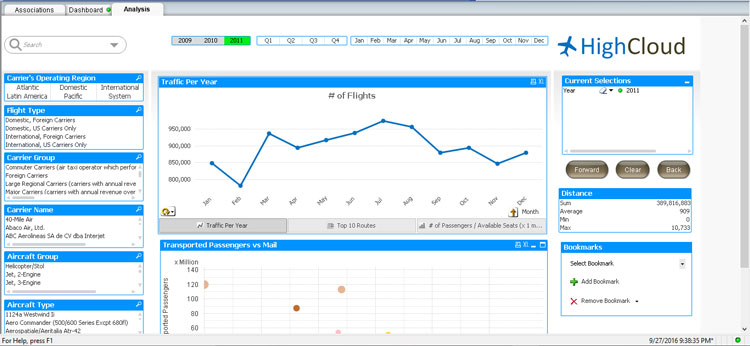
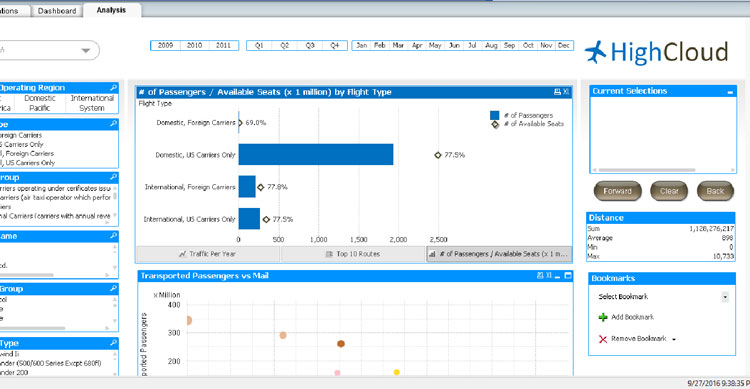
Let’s take a look at a couple of examples. The line chart in the first image serves its purpose but might benefit from a style change.
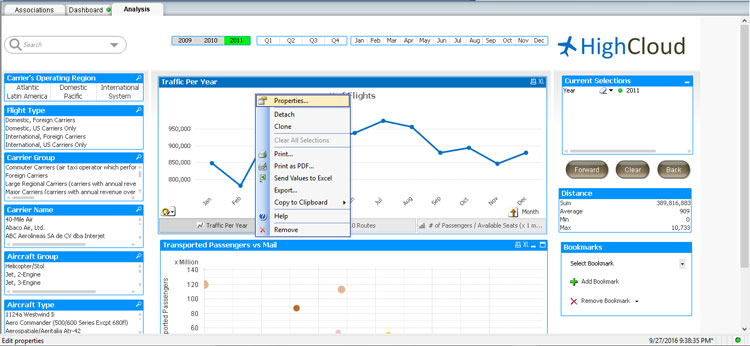
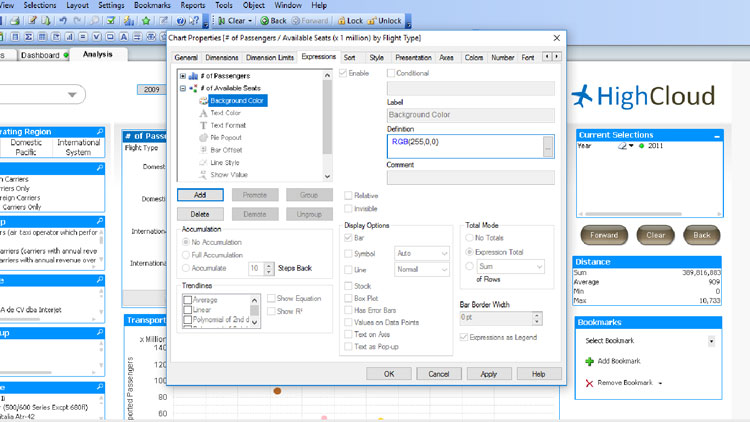
By right-clicking on the chart we can enter the objects properties window. Selecting the Expressions tab allows us to see the expressions that have been used to build the chart. There is a plus sign in front of each expression that when expanded allows us to see the Expression Attributes.
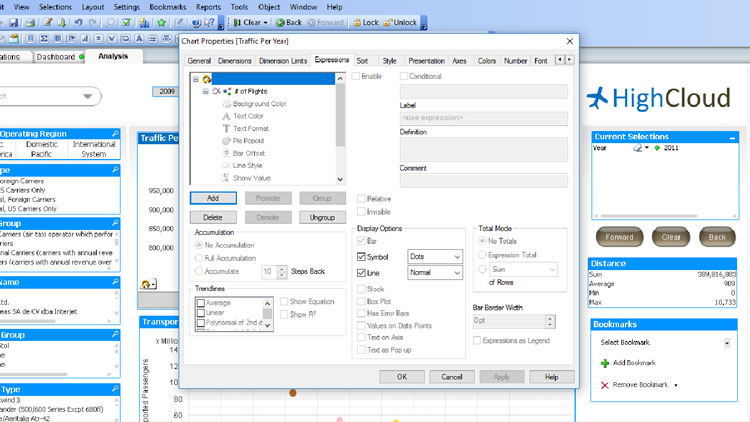
There are several different line styles that can be used:
=’<S1>’ Continuous
=’<S2>’ Dashed
=’<S3>’ Dotted
=’<S4>’ Dotted & Dashed
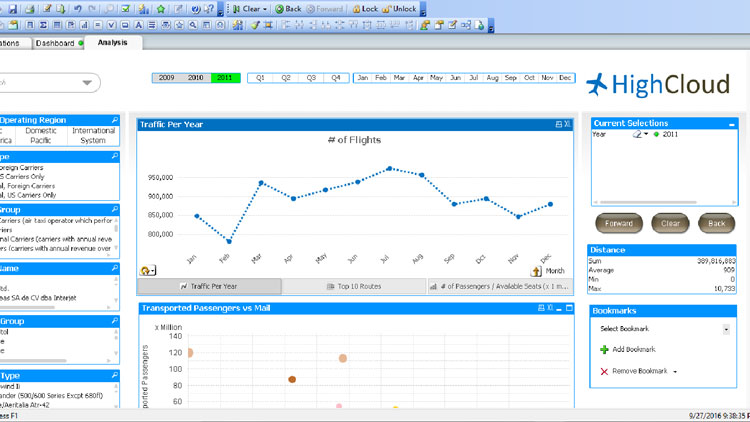
For our example we chose the dotted line.
Our next example eliminates the line of a Combination Chart and replaces it with a Diamond Symbol.
A little change of color for the symbol should add that extra touch. We’ll use the RGB Function to make the Diamond Symbol red.
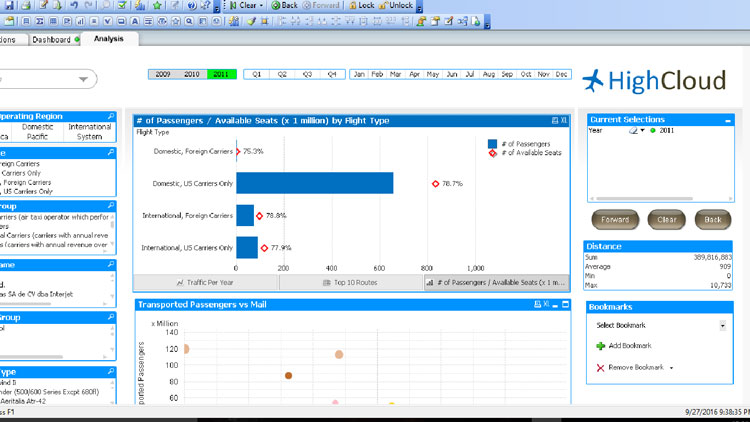
These are just two simple examples of using Expression Attributes to enhance our Qlikview BI application. There is much value to be gained in subtle changes to our visualizations.