QlikView – Always View Chart Bars
Business Intelligence, QlikView
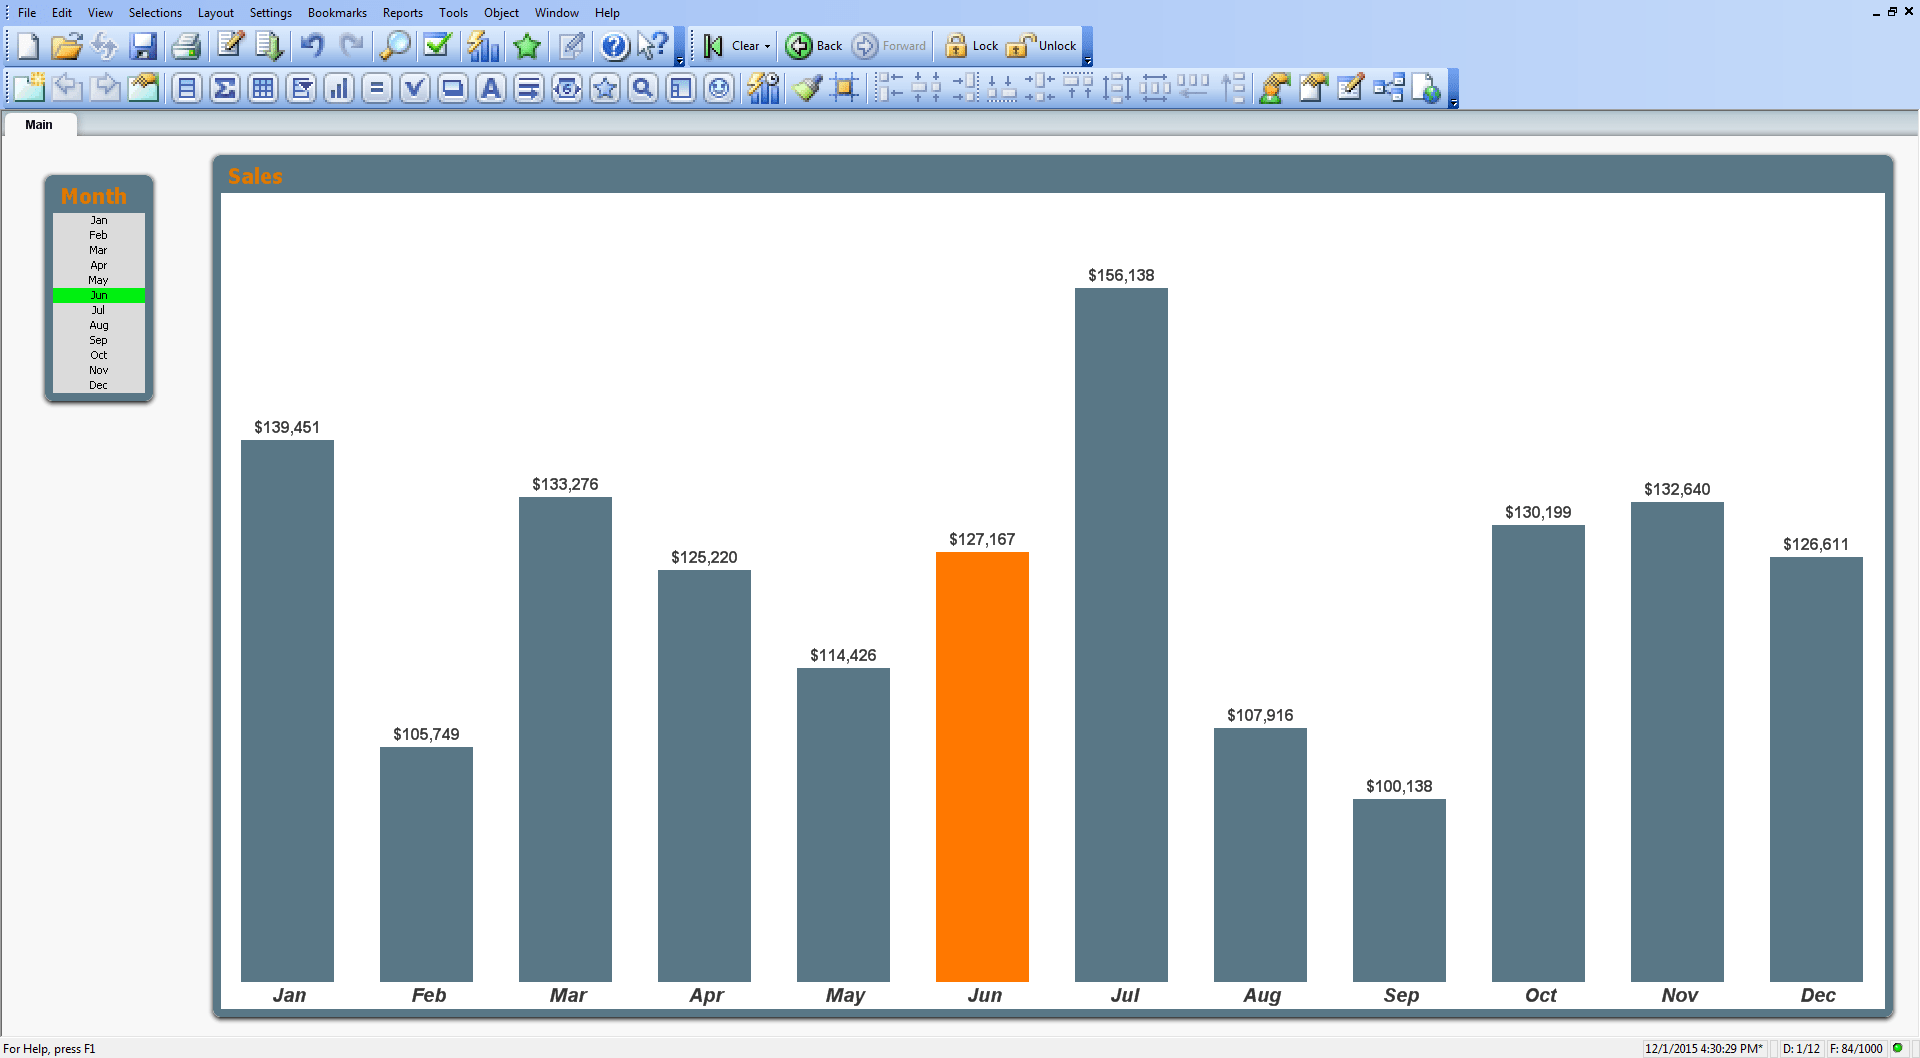
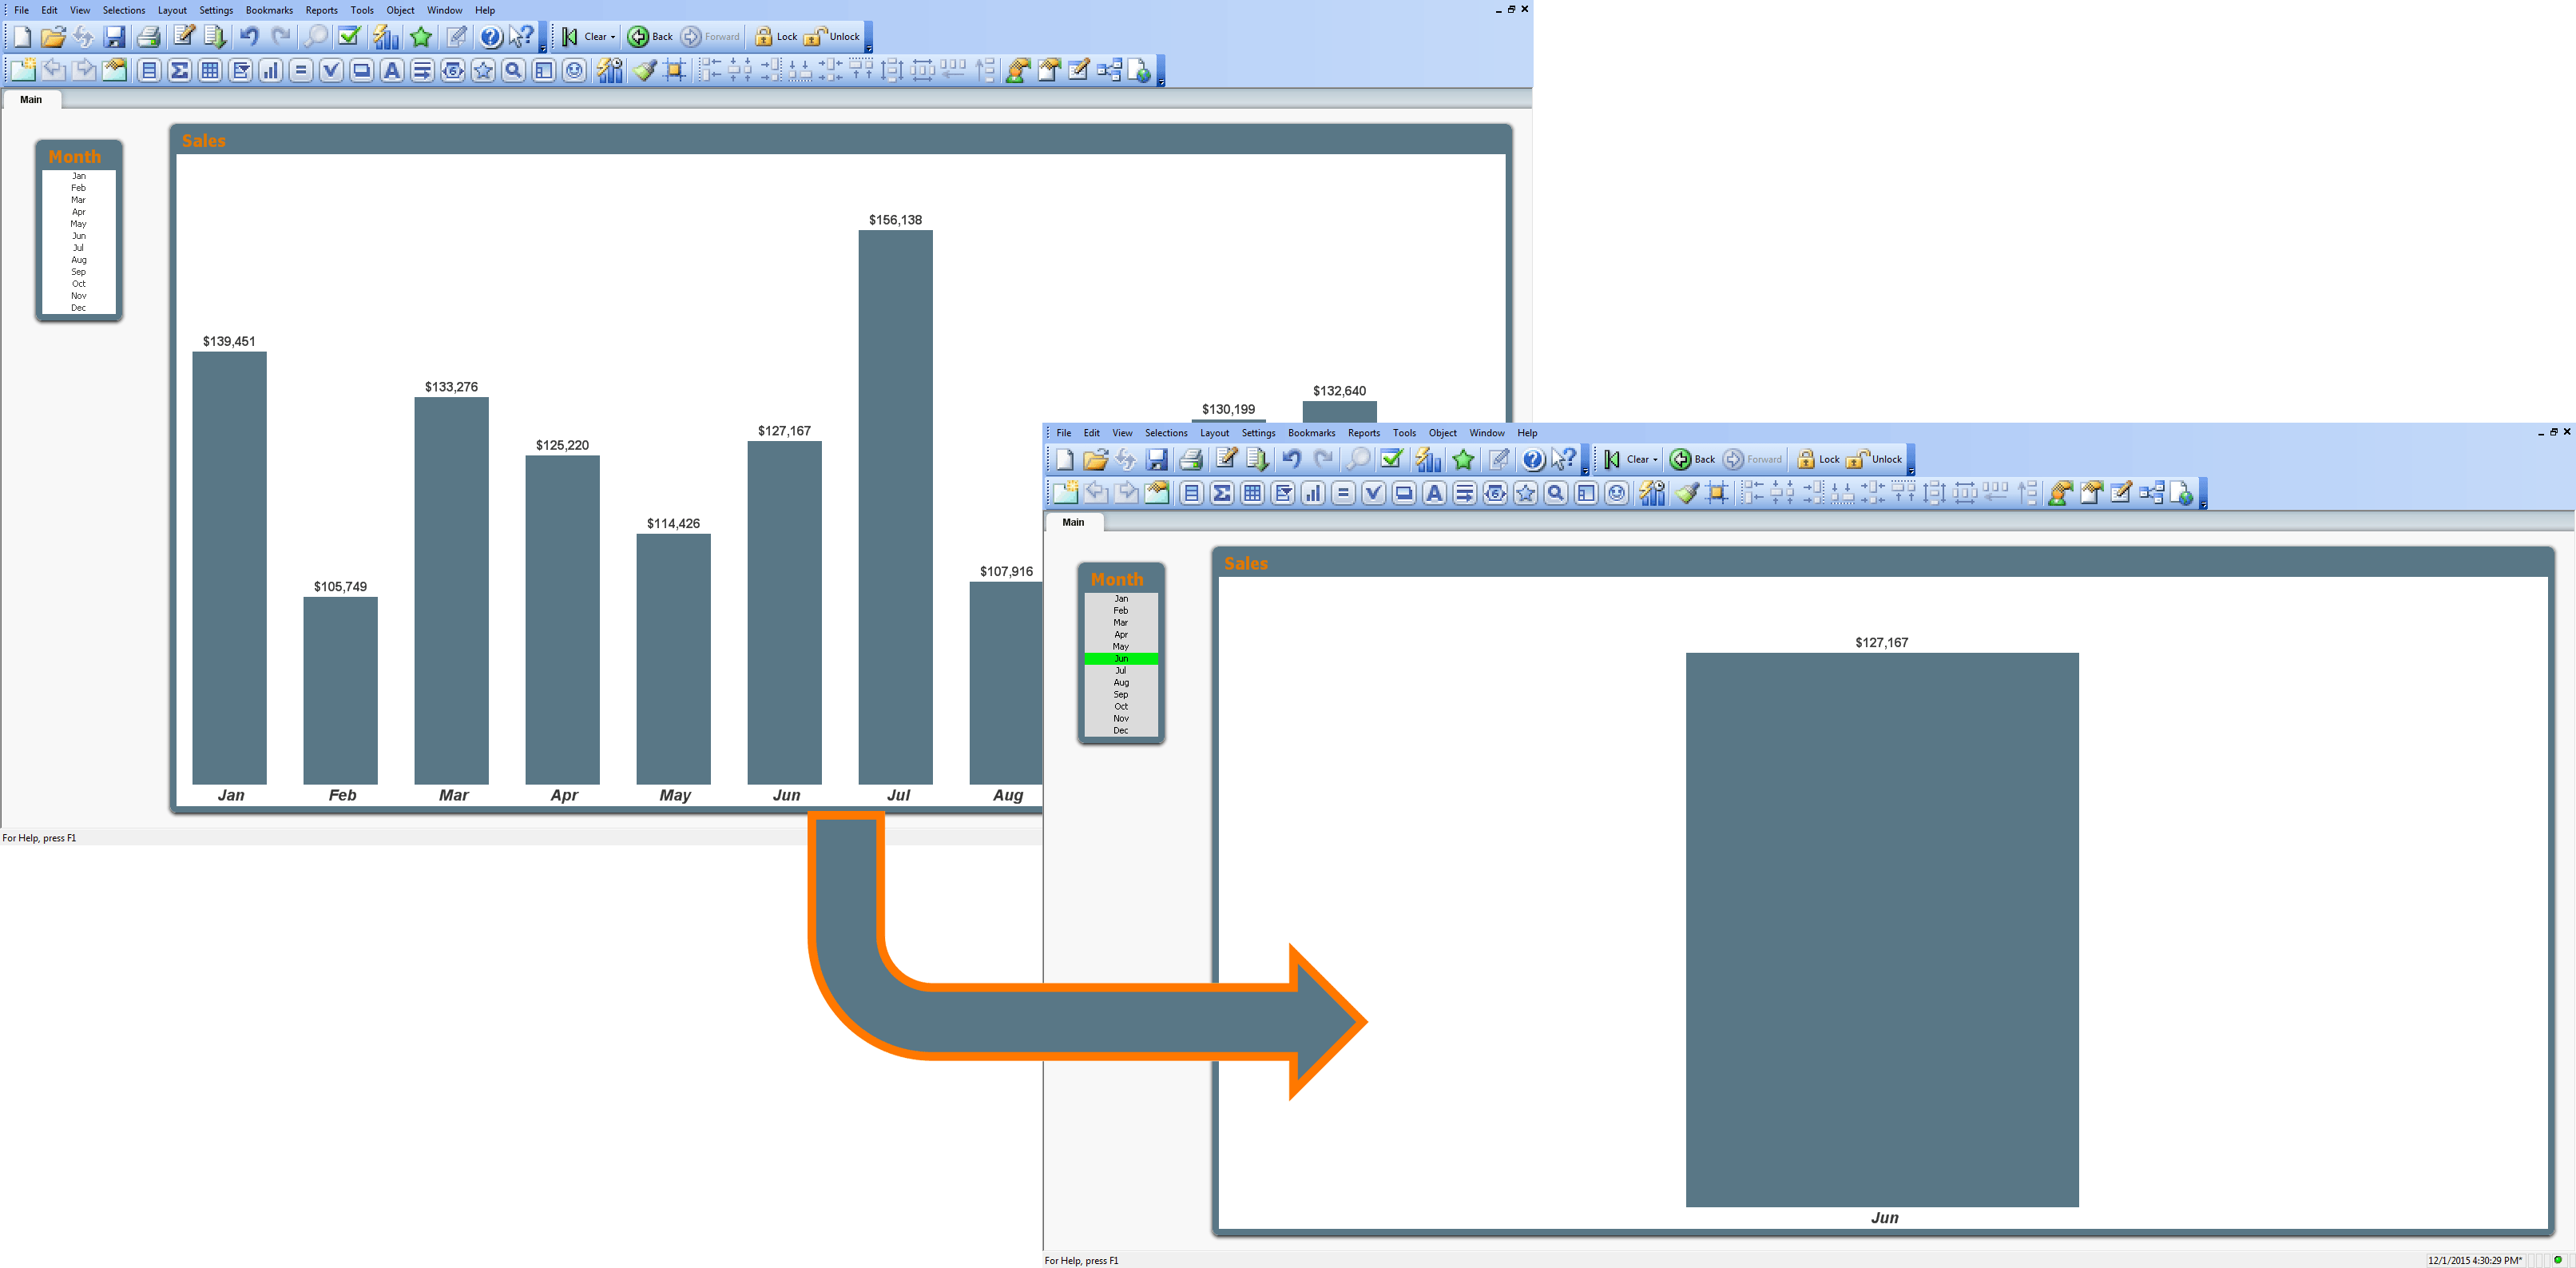
One of my pet peeves (wouldn’t that be a great name for a dog; “Peeve”?) when working with charts in QlikView is that I have a tendency to click on bars accidentally when showing data to colleagues. When I do, all of the bars disappear except for the bar I mistakenly clicked on. And for that millisecond in time, everyone receives a mental jolt that I wish would rather not have happened.
Since I was trying to direct their attention to a particular month, I think a better behavior would have been for the bar to change color to visually separate it from the herd.
I know what you’re thinking; “But how can a QlikView designer, like myself, enable such a behavior?” I’m glad you asked. Here’s the trick.
First, a few facts:
- The chart Dimension is a field named MONTHS
- The Expression is summing a field named SALES
Now, the steps to achieve the desired behavior:
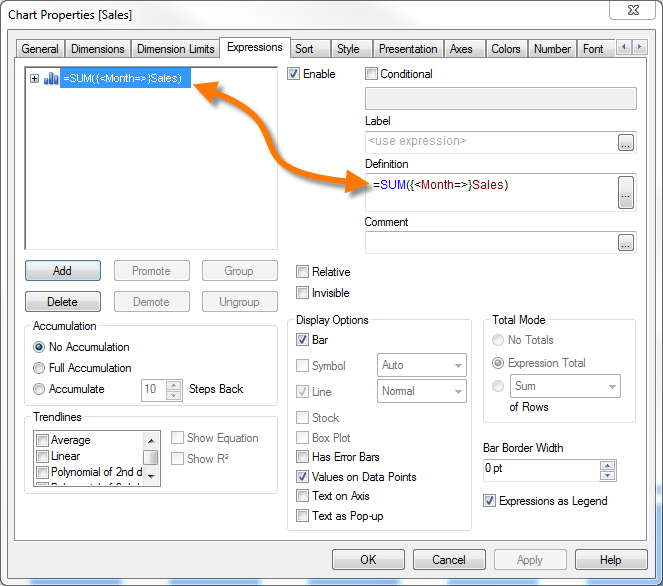
1. Right-click on the chart and select PROPERTIES
2. Activate the EXPRESSIONS tab
3. Select the expression (in this example, it is called Sum(Sales))
4. In the DEFINITION field, type “=SUM({<Month=>}Sales)”
This formula ensures that all bars are visible at all times.
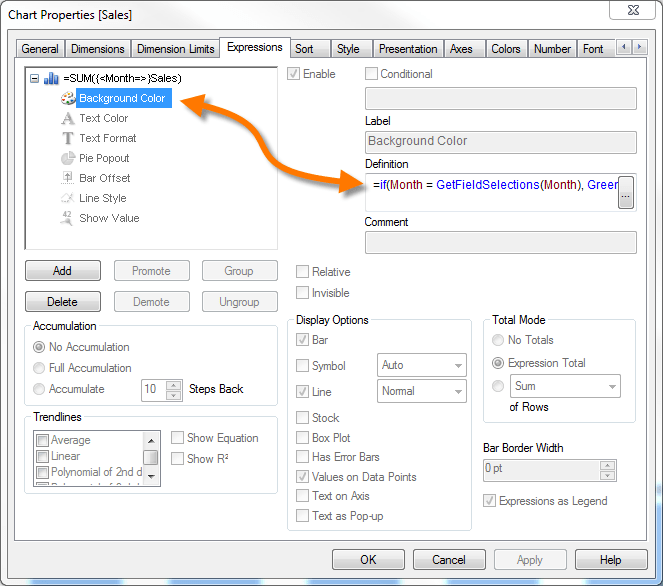
5. In the upper-left corner of the EXPRESSIONS tab, expand the listed express by clicking the plus-sign
6. Select “Background Color”
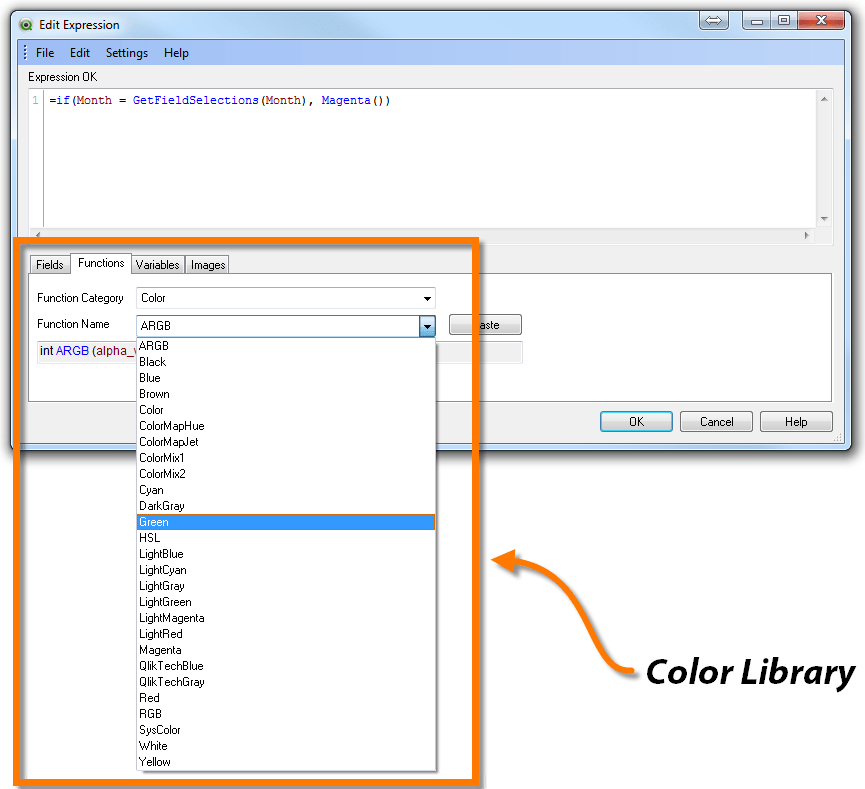
7. In the DEFINITION field, type “=if(Month = GetFieldSelections(Month), Green())”. This formula will change the color of the selected bar to green.
NOTE: You can substitute any of the color codes in the COLOR Category including creating any custom color by using the RGB function (e.g. RGB(255,120,0) for Orange)
Now, you can click from bar to bar with reckless abandon without losing any of the bars on screen.