QlikView – Dynamic Chart Titles

It’s every chart maker’s dream to have dynamically changing titles (well, that and a coffee table that looks like a giant floppy disk.  Seriously; Google that one if you haven’t seen it.  It’s pretty cool.)  Any-hoo…  To have a chart’s title change based on data you are, or are not, filtering by is a real boon to understanding the story that the chart is trying to tell.  Take the following example:QVDCT1
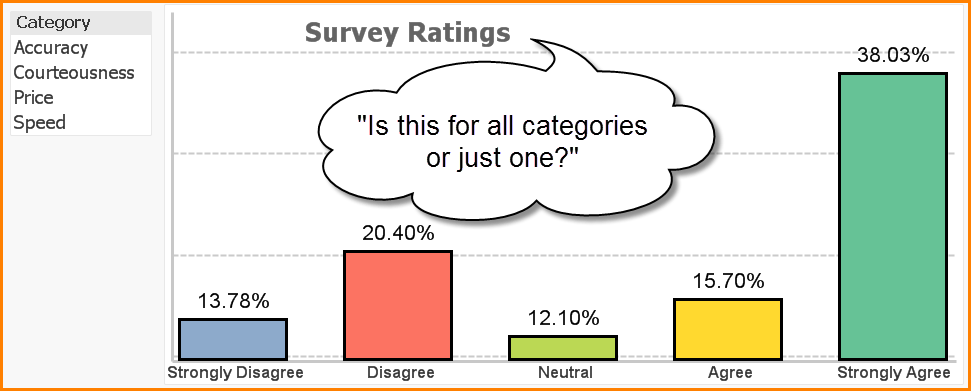
The reader of the chart can look at survey data for four categories all at once as a combined assessment, or they can filter by a specific category and evaluate the ratings individually.  If the chart were to be printed, the reader would not have much of an indication as to whether the chart was displaying all categories or focusing in on a single category.
Enter the DYNAMIC CHART TITLE!!!!!

Read More

QlikView – Scheduled Update of QlikView Reports

Suppose you want your QlikView report to automatically reload its data based on a schedule.  The manual process would be for you to open the report, click the RELOAD button, and then close the file.  If you team up the QlikView report with the Windows Scheduler, you can have this reload take place without human intervention.

Step 1 – Create a Batch File

Open Notepad and enter the following text:

— For users running the 64bit edition of QlikView —

“C:\Program Files\QlikView\QV.EXE” /R “C:\MyQVData\MyQVFile.qvw”

— For users running the 32bit edition of QlikView —

“C:\Program Files (x86)\QlikView\QV.EXE” /R “C:\MyQVData\MyQVFile.qvw”

(Change “C:\MyQVData\MyQVFile.qvw” to the location and name of your QlikView document)

For an explanation of the QlikView command line switches, see the end of this tutorial

Read More

QlikView  – Popular Hotkeys / Shortcuts List

Script Editor

  • <F5> or <Ctrl> + R
    • Runs load script
  • <CTRL> + <Shift> + R
    • Partial reload
  • <Ctrl> + T
    • Shows model diagram
  • <Ctrl> + E
    • Opens table editor for LOAD INLINE statements (cursor should be placed inside statement)
  • <Ctrl> + Q + Q
    • Inserts script that generates several dummy tables
  • <Ctrl> + K + C
    • Comments blocks of script
  • <Ctrl> + K + U
    • Uncomments blocks of script
  • <Ctrl> + F
    • Allows search within the script in the debugger window

Read More

QlikView – Mandatory Include Statement to Prevent Data Inconsistencies

The goal of every QlikView developer is to do as little work as possible.  When you notice that you are writing the same instructions in multiple app scripts, the notion of re-use is a red flag that flies with great fervor.  QlikView’s Include statement provide just such an ability.

The advantages of re-using scripts between multiple apps has several advantages:

  • Complex scripts can be used by multiple people with superficial knowledge of the script’s logic.
  • Include files ensure business process consistency when performing similar actions across multiple apps.
  • Include files expedite script maintenance because the script need only be updated once (in the Include file) and all scripts pointing to the file will automatically incorporate the updates the next time a Reload is executed.

As with anything in life, every “pro” must be accompanied by a commensurate “con”.  In this case, the risk of using Include files to re-use script code lies in the fact that the file containing the script must remain in the same location and the file’s name must remain unchanged.  If either of these two events occurs, the portion of the script pointed to by the Include statement will not execute.

Read More

QlikView – Always View Chart Bars

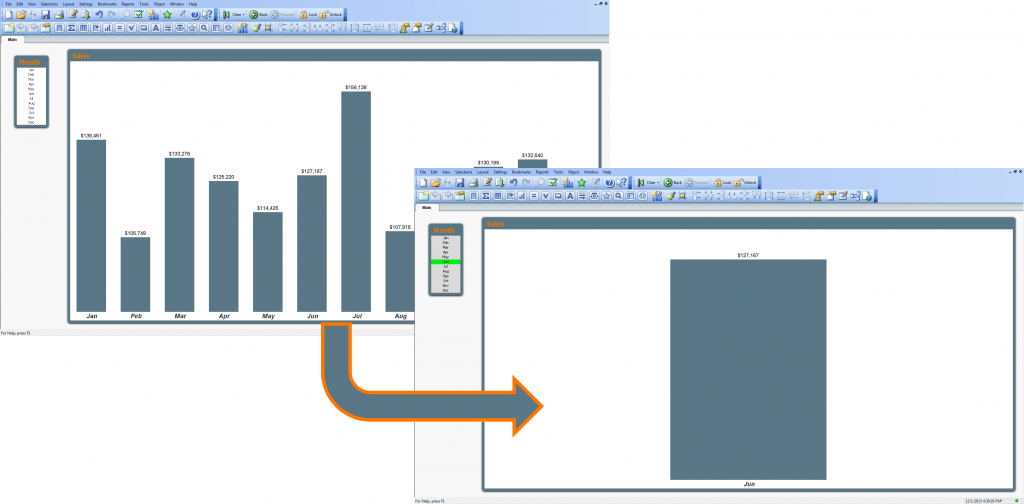
One of my pet peeves (wouldn’t that be a great name for a dog; “Peeve”?) when working with charts in QlikView is that I have a tendency to click on bars accidentally when showing data to colleagues.  When I do, all of the bars disappear except for the bar I mistakenly clicked on.  And for that millisecond in time, everyone receives a mental jolt that I wish would rather not have happened.

ChartBa

Since I was trying to direct their attention to a particular month, I think a better behavior would have been for the bar to change color to visually separate it from the herd.

I know what you’re thinking; “But how can a QlikView designer, like myself, enable such a behavior?”  I’m glad you asked.  Here’s the trick.

Read More

QlikView Preserving Dates in Crosstables

The data transformation tools in QlikView are amazing.  When I think of the hours I have spent working with data that was output by some system trying to get that data into a format that I could then START modeling.  Oh, the wasted man hours.

One of the QlikView transformation tools has the ability to take a crosstable (like a pivot table in Excel) and convert it into a straight table; a traditional flat table where data typically starts.

CTDates1

The only problem with this tool is that it converts all of the data in the crosstable into straight text.  This means that even if you see data that looks like a date (ex: 11/25/2015), it is really just a collection of numbers and slashes.  QlikView does not understand what these numbers represent.  This makes modeling the data a bit problematic.

Read More

QlikView “Allocated Memory Exceeded” Error – An Easy Check

If you have worked with QlikView and encountered the error message “Allocated Memory Exceeded”, there could be numerous reasons for this message.  You may have a quite a quest in store for yourself to figure out what the issue is.  But there’s quick and easy thing to check that may just be the reason for your plight.

If you have been writing expressions, one of the primary culplits for generating this memory error is a simple syntax error with your expression.

Here’s just such a scenerio:  You have created a fantastic pie chart and wish to add some intelligence to the chart.

Read More

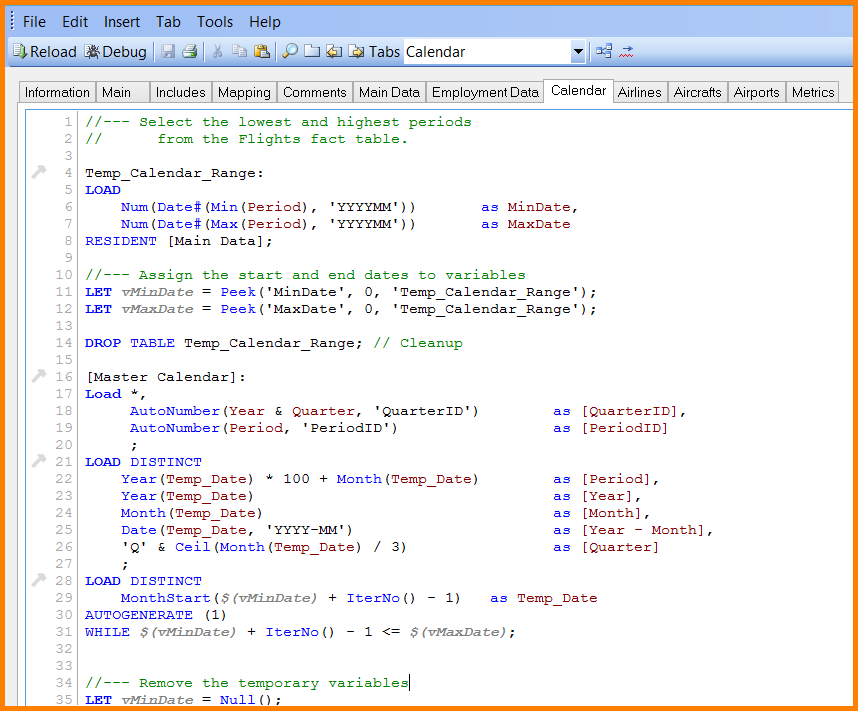
QlikView 11 Script Editor Color Codes

Have you ever been looking at your scripts in QlikView and thought to yourself, “What do all these different colors represent?” 

QV1

Well, puzzle yourself no further.  I am here to explain what all of these colors are trying to say and then show you how to change them if you have your own color preferences.

Read More

QlikView Training

  SkillForge is happy to announce QlikView Training – offered both as live, onsite classes and live, online classes. Business Intelligence is a major area of interest to most companies these days. With data stored in multiple different sources (mainframes, client server databases, etc.) – …

Read More