QlikView – Always View Chart Bars

One of my pet peeves (wouldn’t that be a great name for a dog; “Peeve”?) when working with charts in QlikView is that I have a tendency to click on bars accidentally when showing data to colleagues.  When I do, all of the bars disappear except for the bar I mistakenly clicked on.  And for that millisecond in time, everyone receives a mental jolt that I wish would rather not have happened.

ChartBa

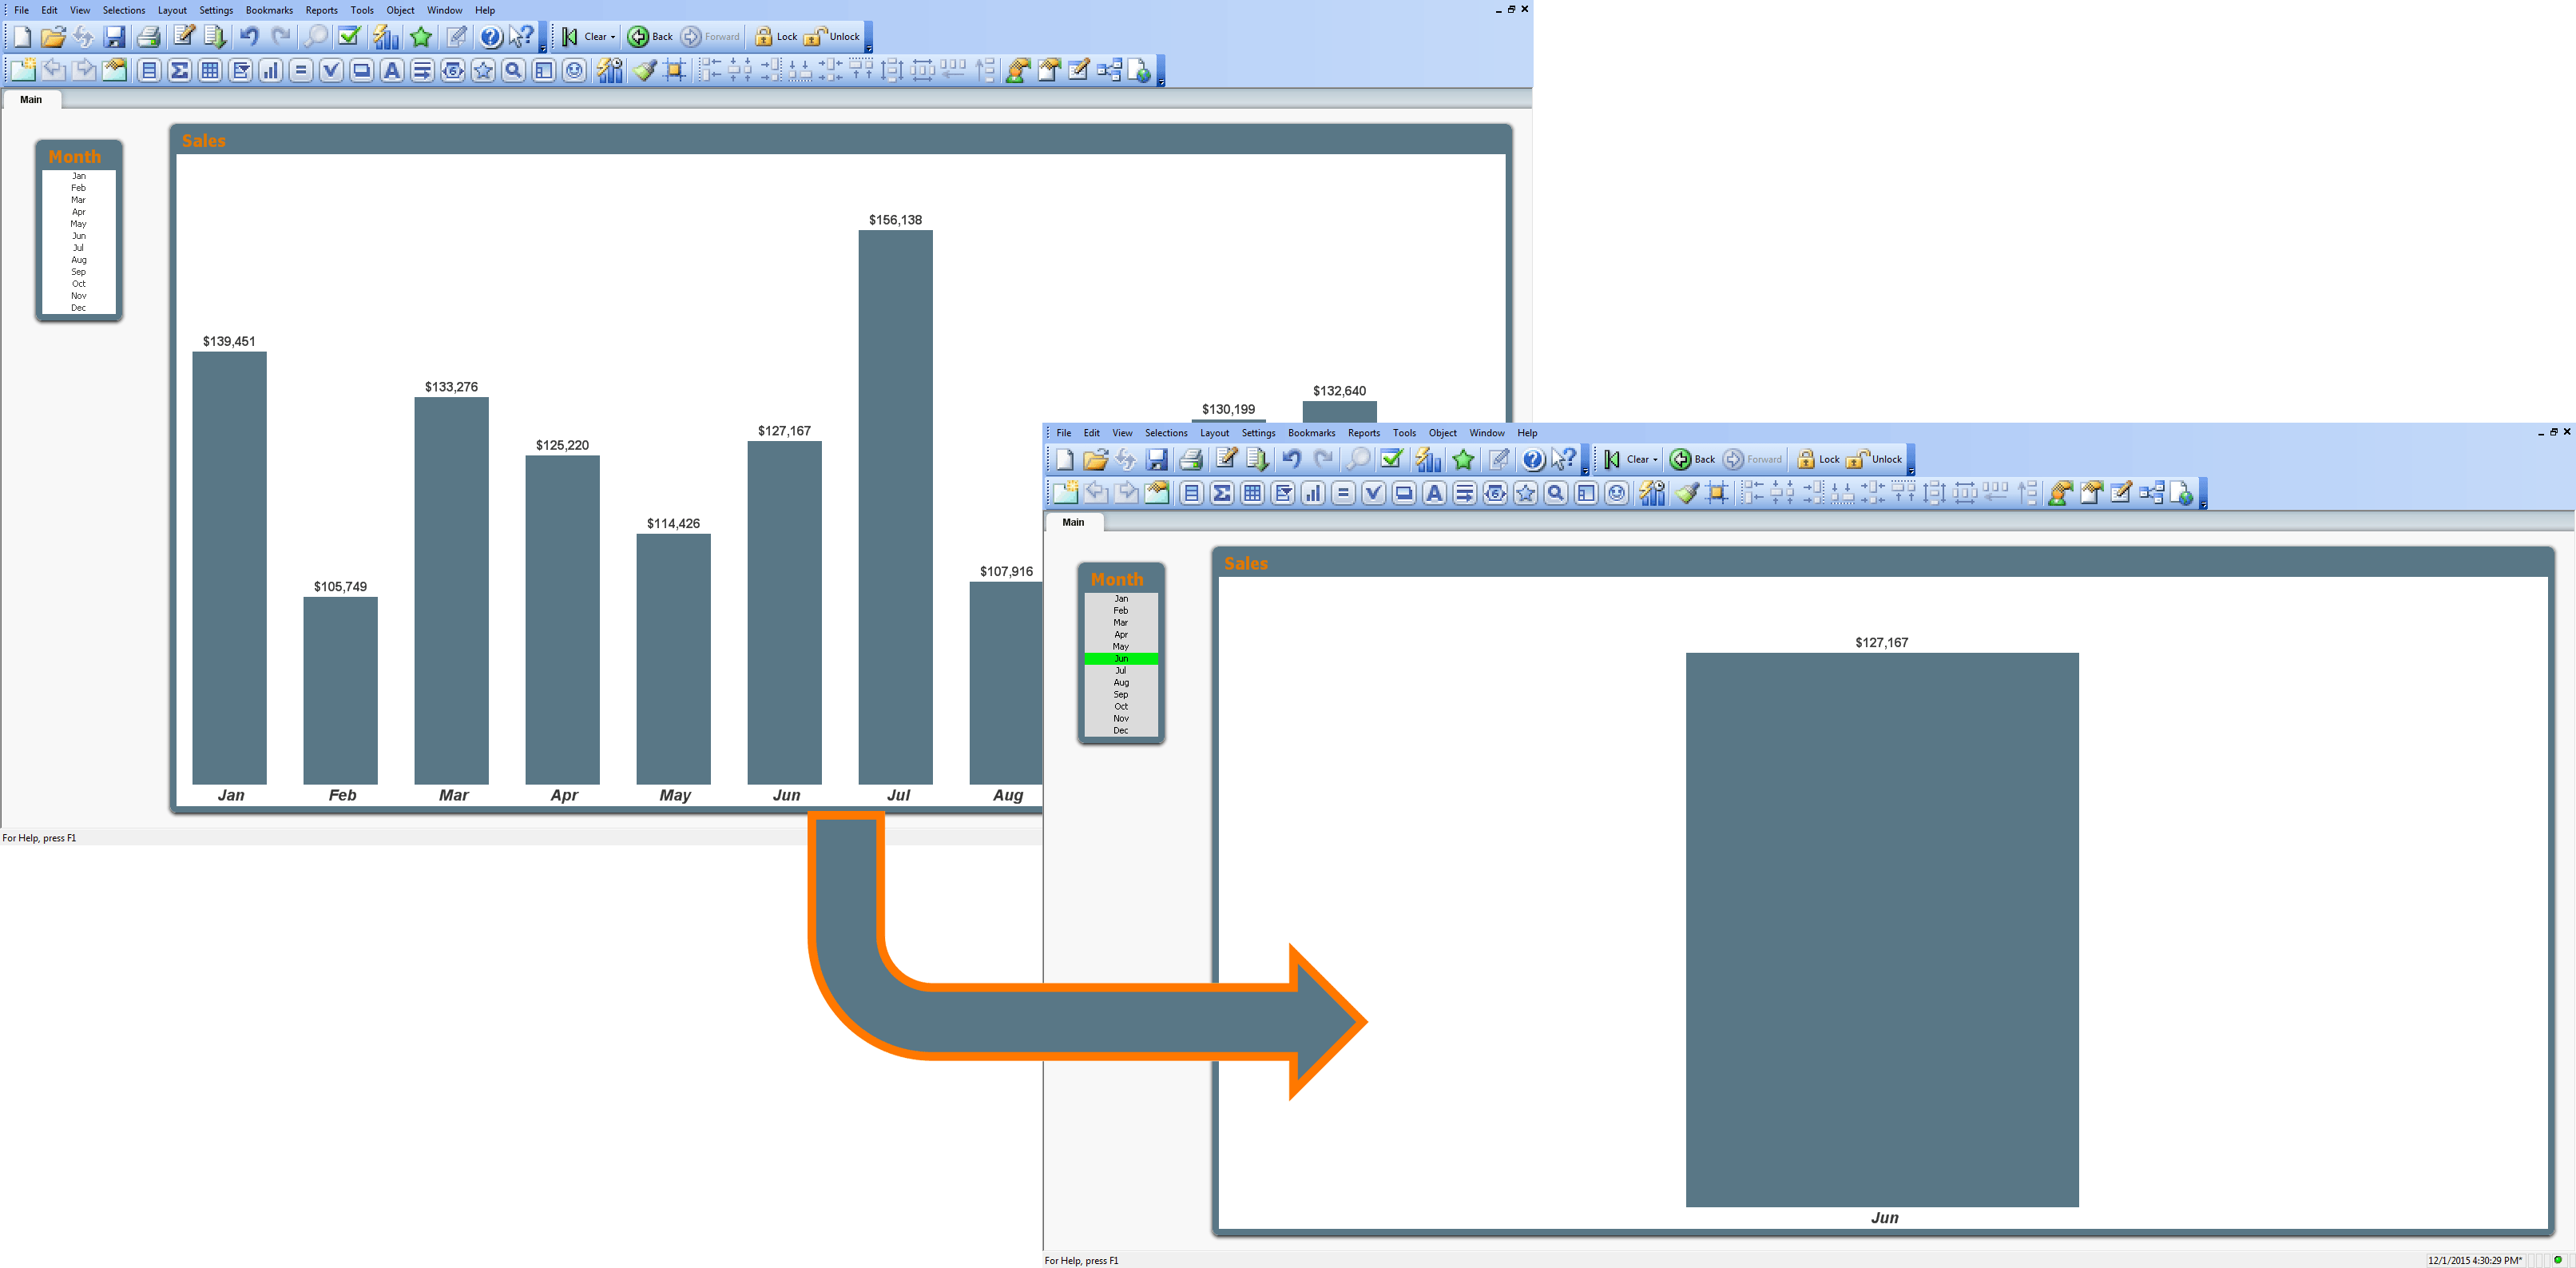
Since I was trying to direct their attention to a particular month, I think a better behavior would have been for the bar to change color to visually separate it from the herd.

I know what you’re thinking; “But how can a QlikView designer, like myself, enable such a behavior?”  I’m glad you asked.  Here’s the trick.

Read More

QlikView Preserving Dates in Crosstables

The data transformation tools in QlikView are amazing.  When I think of the hours I have spent working with data that was output by some system trying to get that data into a format that I could then START modeling.  Oh, the wasted man hours.

One of the QlikView transformation tools has the ability to take a crosstable (like a pivot table in Excel) and convert it into a straight table; a traditional flat table where data typically starts.

CTDates1

The only problem with this tool is that it converts all of the data in the crosstable into straight text.  This means that even if you see data that looks like a date (ex: 11/25/2015), it is really just a collection of numbers and slashes.  QlikView does not understand what these numbers represent.  This makes modeling the data a bit problematic.

Read More