If there has ever been a more “You’ve got your chocolate in my peanut butter!” moment, it’s the blending of Conditional Formatting with the Subtotals tool in Excel.
If you have ever used the Subtotals tool to group information you have probable been impressed with its ability to group data by some changing event (like States) and have those groups aggregated and then structured into a collapsible outline.
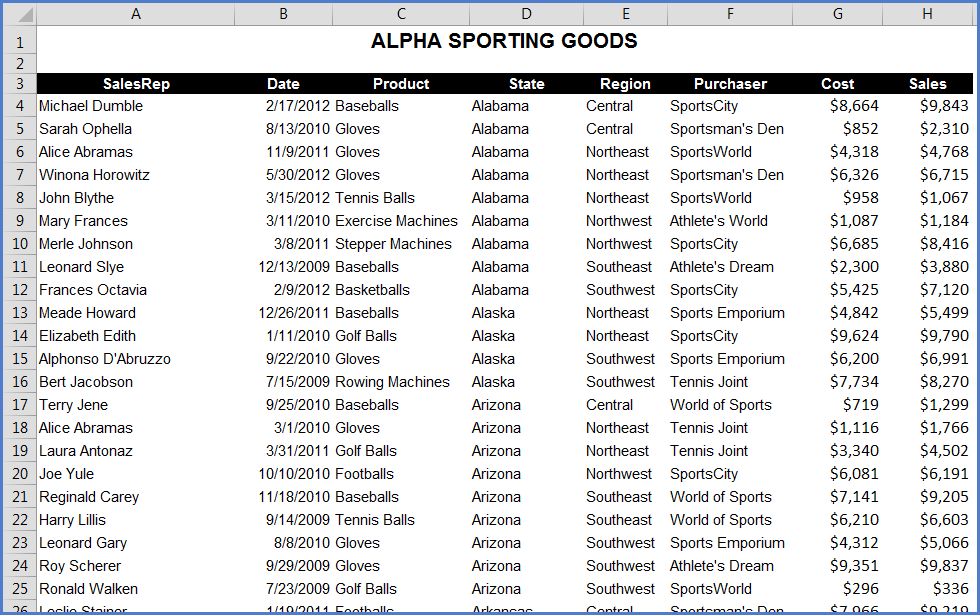
Before Subtotals
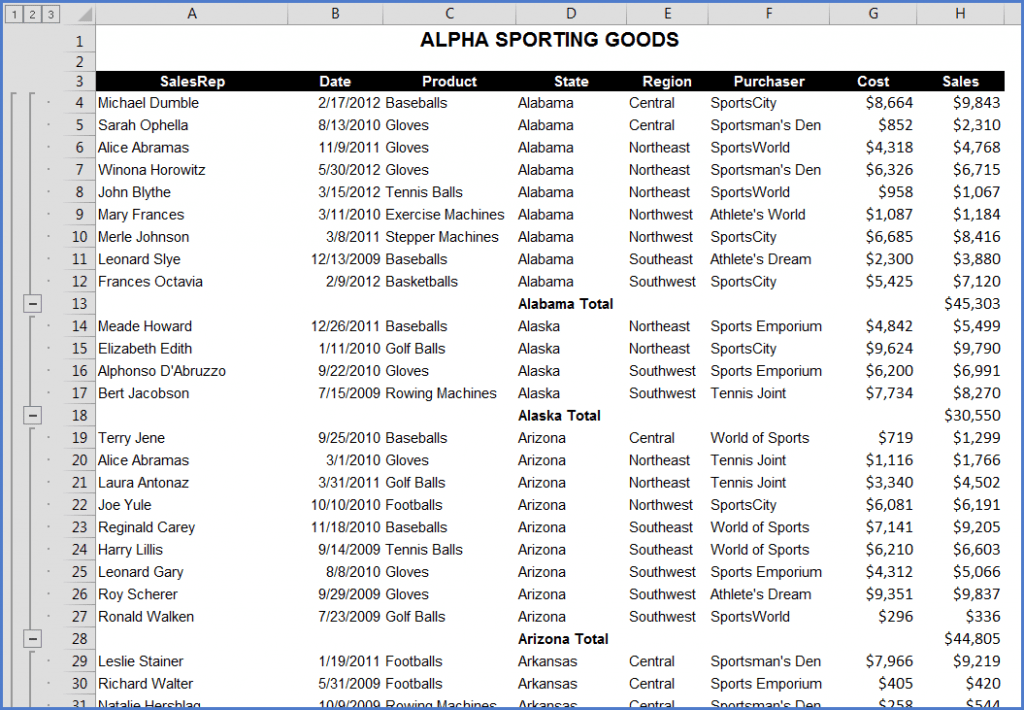
After Subtotals
But the one shortfall when it comes to the Subtotals tool is that there are no built-in artistic styles that can be applied to give the list a bit of pizazz.